

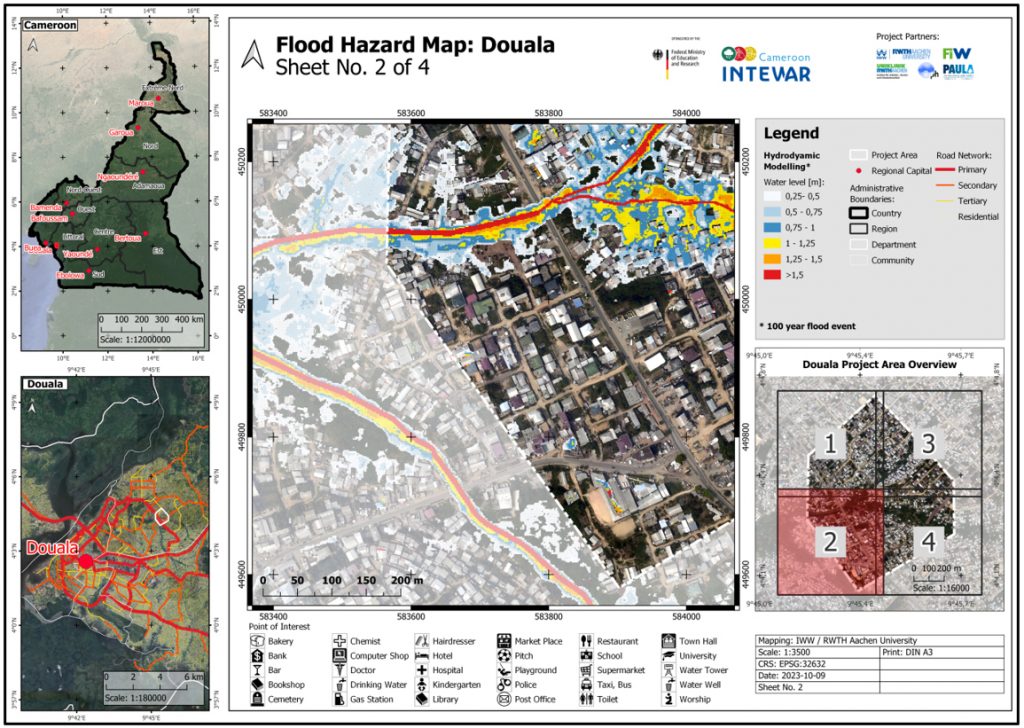
One of the project goals is to develop flood hazard and flood risk maps for all the project regions (Soa, Douala, Nguosso) after carrying out hydraulic runoff simulations for different return periods. The traditional methodological approach was adopted to carry out hydraulic simulations, and the flood hazard map was updated for every return period accordingly (see Flood Hazard Map). The methodological steps can be visualized in the attached figure and briefly described as follows:
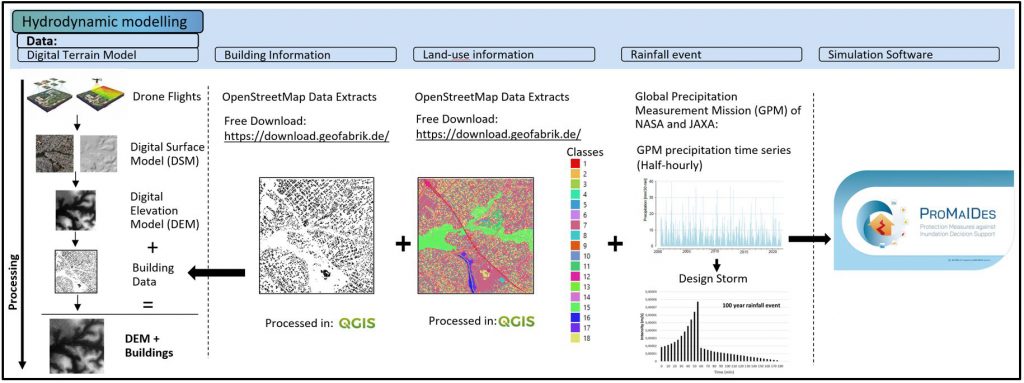
Hydrodynamic modelling was performed using the open-source software named ProMaIDes (Protection measures against Inundation Decision support) (Developed at the IWW, RWTH Aachen). Data requirements for running hydraulic runoff simulation include digital terrain data, building information, land-use information and rainfall data. As data availability is scarce in the project area, data acquisition was based on a drone survey, open source infrastructure data, collection and editing of land use data, and the perusal and processing of rainfall data into representative rainfall events. A short summary of each aspect is given below:
Digital terrain model:
Detailed information on the shape of the terrain and the geographical features is necessary to calculate the flow and the accumulation of water precisely. The high-resolution data of the digital terrain model (DTM) and the aerial images of the study regions have been provided to us after photogrammetry of the region by a local company, SOGEFI. However, it is also possible to obtain the free-DTM with lower resolution from satellite observations (e.g., SRTM, ALOS PALSAR, ASTER GDEM). In addition, such data from photogrammetry inconsistently predict the elevation in regions around trees, bridges etc. Hence, processing the data to remove additional features such as buildings, bridges, and trees is necessary (see attached figure).
Building Information:
A DTM alone, without consideration of buildings, cannot adequately reflect reality, which is especially true for densely populated areas like Cameroon. Hence, the building information is supplied externally from the OpenStreetMap Data extracts (https://download.geofabrik.de/) to create the blockage.
Land-use information:
The land-use information is necessary to precisely model the runoff based on the roughness of the surface. The OpenStreetMap Data extracts (https://download.geofabrik.de/) are used for the creation of land use information. At specific locations where the land use is not correctly identified, land use was manually processed at specific regions using QGIS.
Model rainfall event:
A 3-hour rainfall model was created based on the data from the GPM (Global Precipitation Measurement) mission of NASA and JAXA. The dataset from GPM included 21 years and three months of precipitation depths at half-hour intervals. The spatial resolution was 0.1° x 0.1° ( 10km x 10km). For the analysis of heavy rainfall, the tile with the coordinates 4.15°N 9.95°E was downloaded from the Giovanni internet service. An Euler type II Rainfall model for different return periods (5 years, 20 years, 50 years and 100 years) is created following the steps of KOSTRA-DWD („Koordinierte Starkniederschlagsregionalisierung und -auswertung des DWD“).
Simulation Software:
The software package chosen for the hydraulic runoff modelling was ProMaIDes. ProMaIDes is a free software for the risk-based assessment of flood protection measures for river, urban, and coastal flooding and supports the entire modelling process from the setup to the visualization and interpretation of the results. The software was created in 2007 at the Institute of Hydraulic Engineering and Water Management at RWTH Aachen University and since then has been further developed and expanded (Bachmann, ProMaIDes, 2022).
For more information, see: https://promaides.h2.de/promaides/